Public Art, Public Data, and the Question of Access
June 2nd, 2026
Public art sounds like it should be easy to find. The phrase itself gives the impression of openness, implying art that belongs to the public, lives in public, and can be encountered by anyone. But when I started looking at Washington’s State Art Collection as data, I realized that “public” is not as simple as it sounds.
An artwork can be publicly owned and still be inside a school hallway, a university building, a government office, or another space that people do not, or cannot, casually walk into. It can be part of a statewide collection and still be more visible to some communities than others. It can exist in public, but still need data, maps, metadata, and search tools to help people actually know it is there.
That tension is what drew me to the Washington’s State Art Collection dataset. I wanted to examine it not only as a group of artworks, but as an information resource. Where are these works located? What kinds of art appear most often? What kinds of spaces host them? And what does the data help us see that might otherwise remain scattered across individual buildings and local sites?
The Dataset
The dataset I used is Washington’s State Art Collection (2024-07-15), available through Washington State’s open data portal, Data.WA. It is connected to ArtsWA, the Washington State Arts Commission, which manages the State Art Collection. Each row represents one artwork and includes information such as title, artist, city, art site, art type, materials, date made, address, latitude, longitude, and ID number.
Before creating visualizations, I did a small amount of cleaning and checking. The dataset was mostly complete, but a few fields had missing values. Measurements had 10 missing entries, location had 3, address had 2, and date made had 1. I also checked the latitude and longitude columns because I wanted to map the artworks. A couple of longitude values had formatting issues, so I corrected those manually before creating the map. I also reviewed duplicate ID numbers. Most repeated IDs seemed to reflect location or status differences rather than simple duplicate records, but I removed one true duplicate after checking it manually.
That cleaning process was small, but important, especially since a map can feel convincing just because it looks polished, but a few incorrect coordinates or duplicate records can change the story it tells. After checking the missing fields, correcting coordinate issues, and reviewing repeated IDs, I felt more comfortable using the data to ask a larger question: where does Washington’s State Art Collection actually appear?
A Statewide Collection, but Not an Even Spread
Figure 1. Where Washington’s State Art Collection is located. Each point represents an artwork with available latitude and longitude data.
The map gives the first broad view of the collection. The artworks appear across Washington, from the Puget Sound region to eastern Washington, with visible points in places like Spokane, Pullman, Yakima, Vancouver, Olympia, Tacoma, Seattle, Bellingham, and Port Angeles. On the surface, this supports the idea of a statewide public art collection.
But the pattern is not evenly spread. The points cluster heavily around certain cities and institutional areas. Western Washington is dense with points, especially around the Seattle-Tacoma-Olympia corridor. Spokane also appears as a clear cluster in eastern Washington. Smaller clusters show up around places like Vancouver, Bellingham, Yakima, and Pullman.
This is where the map starts to complicate the word “public.” If the collection is public, but the artworks are concentrated around certain cities or institutions, then access is partly shaped by geography. Someone living near Olympia, Seattle, or Tacoma may have many more chances to encounter works from the State Art Collection than someone in a more rural area. The art may belong to the public, but physical proximity still matters.
The map is also useful because it keeps the artworks tied to place. Each point is not just a count. It represents an actual artwork, by an actual artist, located in a specific site. That felt important to preserve because cultural data can easily become too abstract once it turns into rows, columns, and charts.
Olympia Stands Out
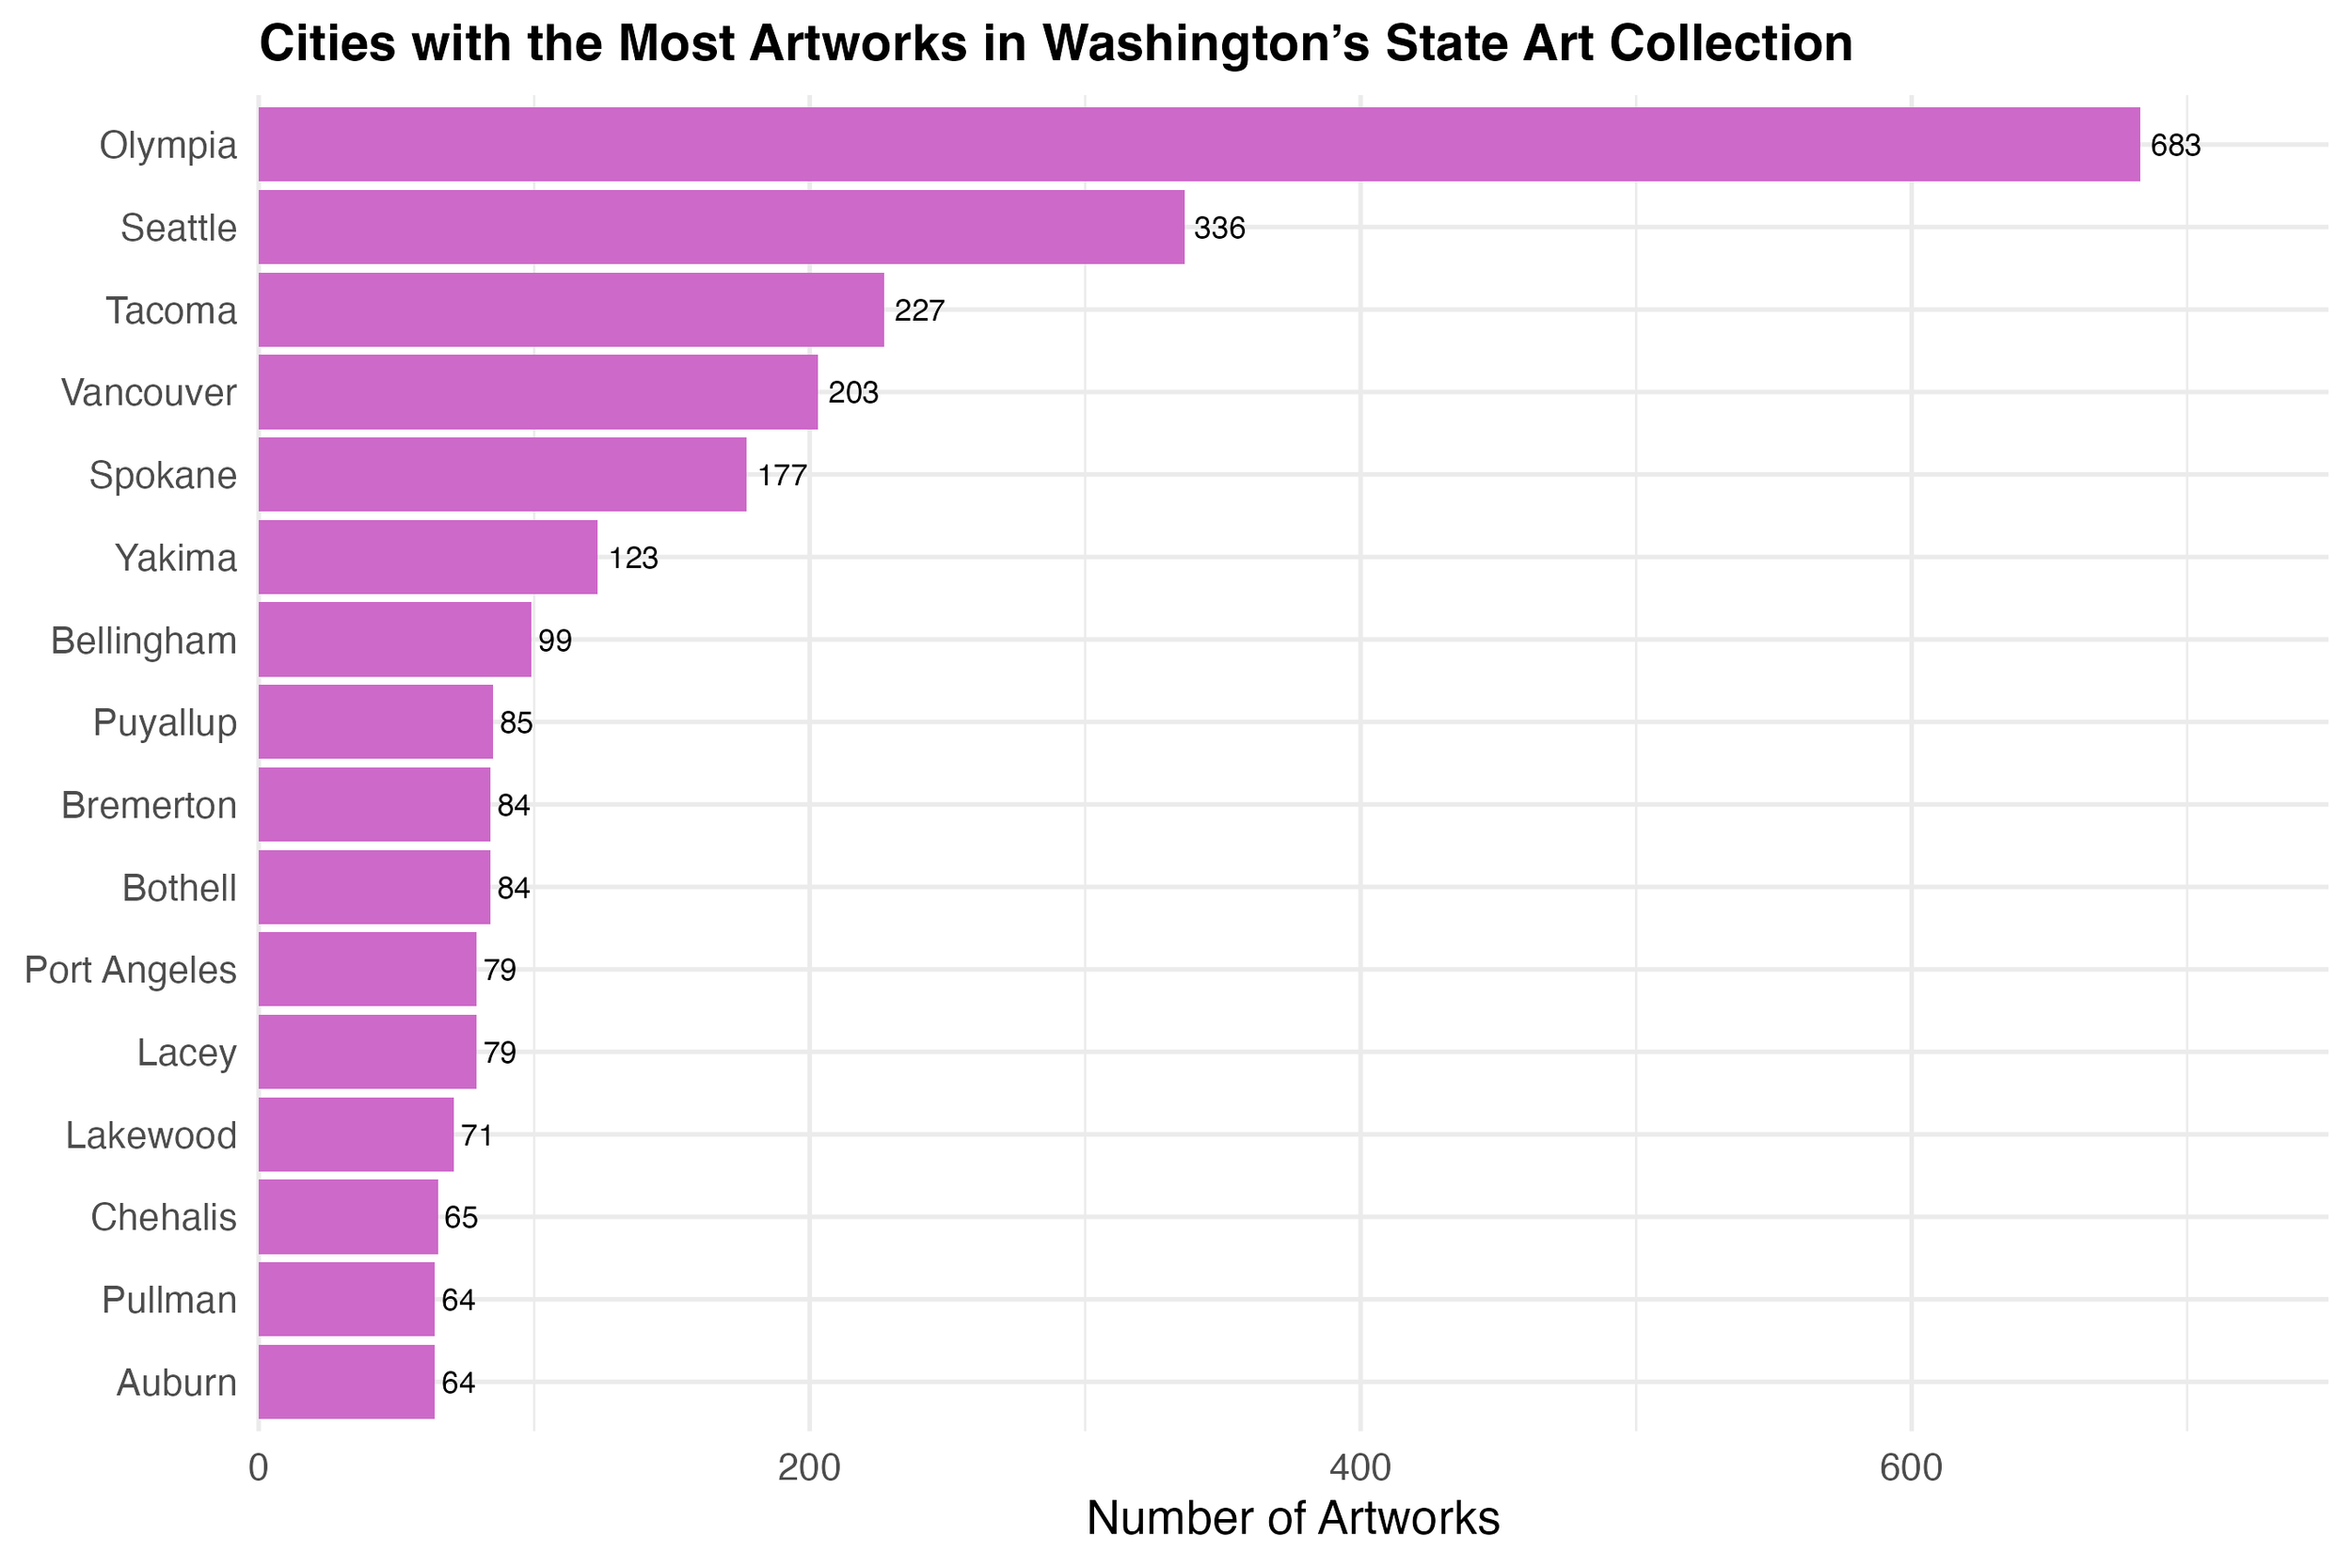
Figure 2. Cities with the most artworks in Washington’s State Art Collection.
The city chart makes the concentration even clearer. Olympia has 683 artworks, far more than any other city in the top 15. Seattle comes next with 336, followed by Tacoma with 227, Vancouver with 203, and Spokane with 177.
Olympia’s lead is striking, but it is not random. As the state capital, Olympia has a large concentration of state buildings, offices, and public institutions. That institutional presence likely helps explain why so many artworks are recorded there. The chart is not just showing where art happens to be placed. It is also showing how public infrastructure shapes the collection.
Seattle, Tacoma, Vancouver, and Spokane also appear near the top, which points to another pattern: larger cities and civic centers tend to have more artworks. These are places with more public buildings, schools, campuses, and agencies, so they have more potential sites for state-owned art.
What I found interesting is that the dataset is statewide, but the top cities still tell a story of concentration. A public collection can be distributed across a state while still being much more visible in some places than others. This is one of the main things the data helped me see. Public access is not only about whether an artwork is technically available. It is also about where it is placed and who is likely to pass by it.
The Collection is Mostly Sculpture and Painting
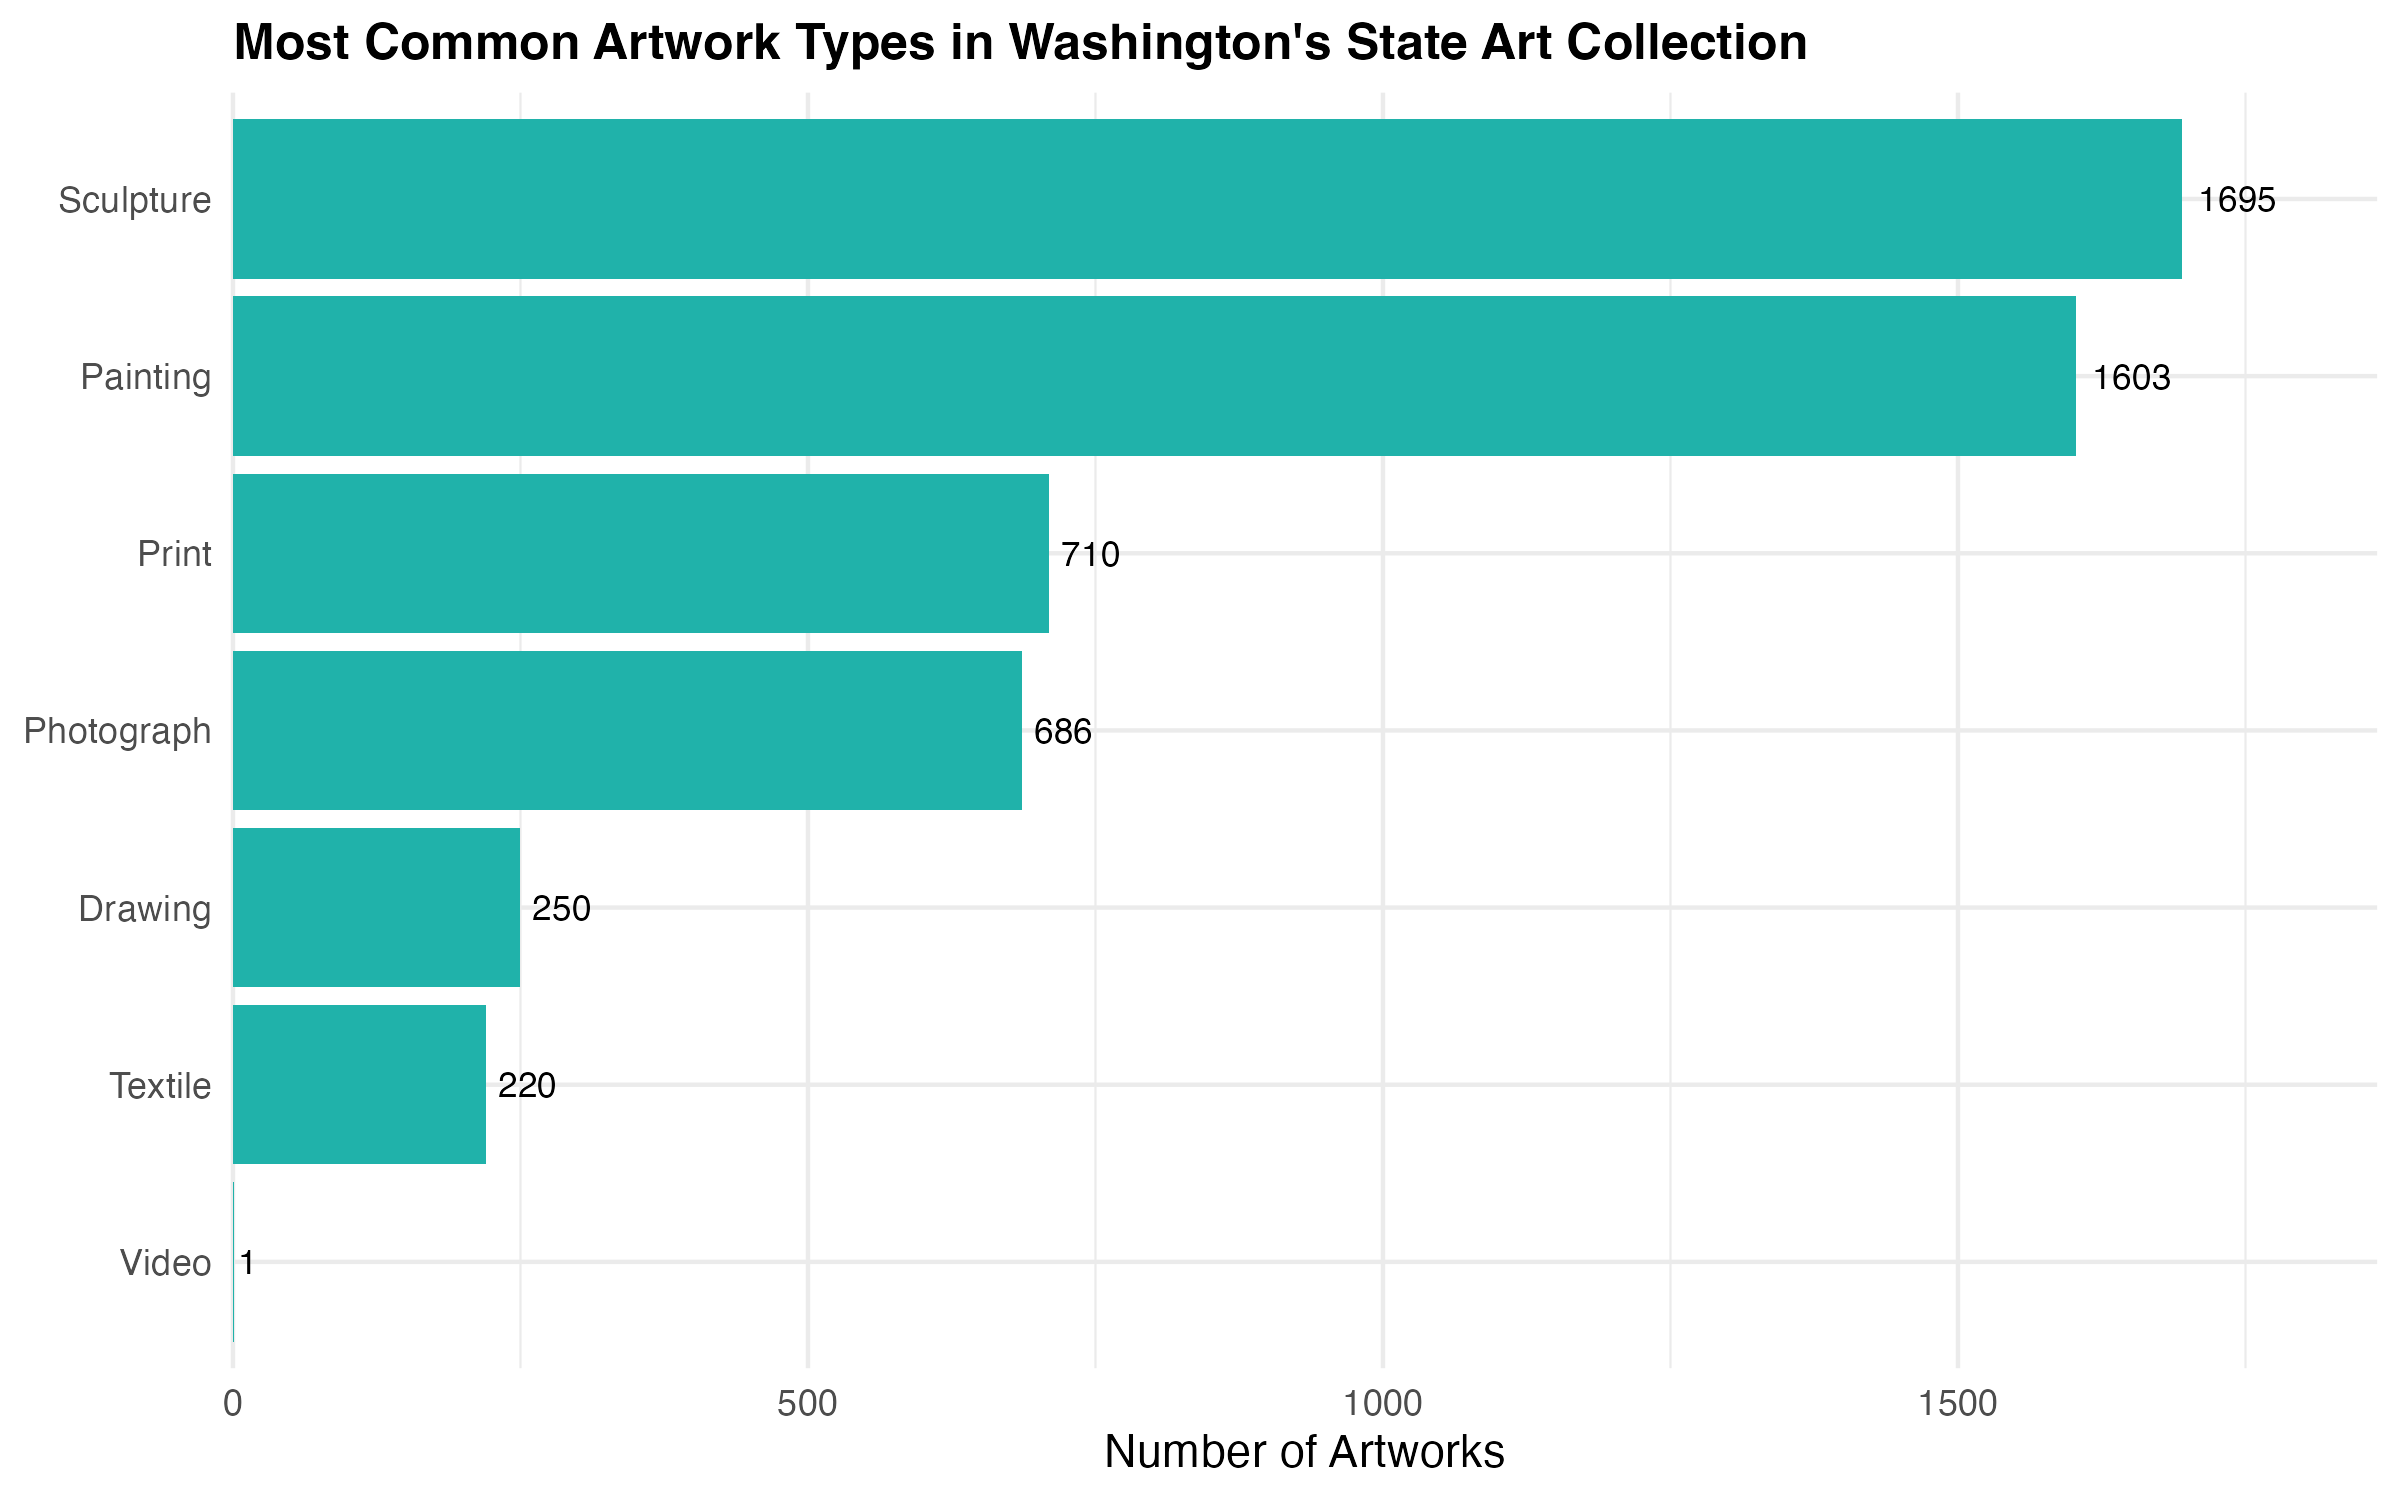
Figure 3. Most common artwork types in Washington’s State Art Collection.
The next question I looked at was what kinds of artworks make up the collection. Sculpture and painting are the two largest categories. Sculpture appears 1,695 times, and painting appears 1,603 times. After that, the numbers drop, with print appearing 710 times, photograph 686 times, drawing 250 times, textile 220 times, and video only once.
This tells a different part of the story. The State Art Collection includes a range of formats, but it is dominated by traditional visual art forms. Sculpture and painting together make up the largest share by far. Prints and photographs are also strongly represented, while drawing, textile, and video appear much less often.
The dominance of sculpture and painting says something about what kinds of art become practical, visible, and collectible in public spaces. Sculpture can occupy shared space in a direct way. Painting, prints, and photographs can be displayed inside schools, offices, libraries, and campuses. Video, on the other hand, may require equipment, maintenance, and specific viewing conditions, which could help explain why it barely appears in the dataset.
This chart also reminded me that “public art” is not a single category in practice. It can be permanent, portable, indoor, outdoor, visual, material, digital, or site-specific. But once the collection becomes data, those differences are grouped into a few categories. That makes analysis possible, but it also smooths over some of the complexity of the artworks themselves.
Public Art Lives Inside Institutions
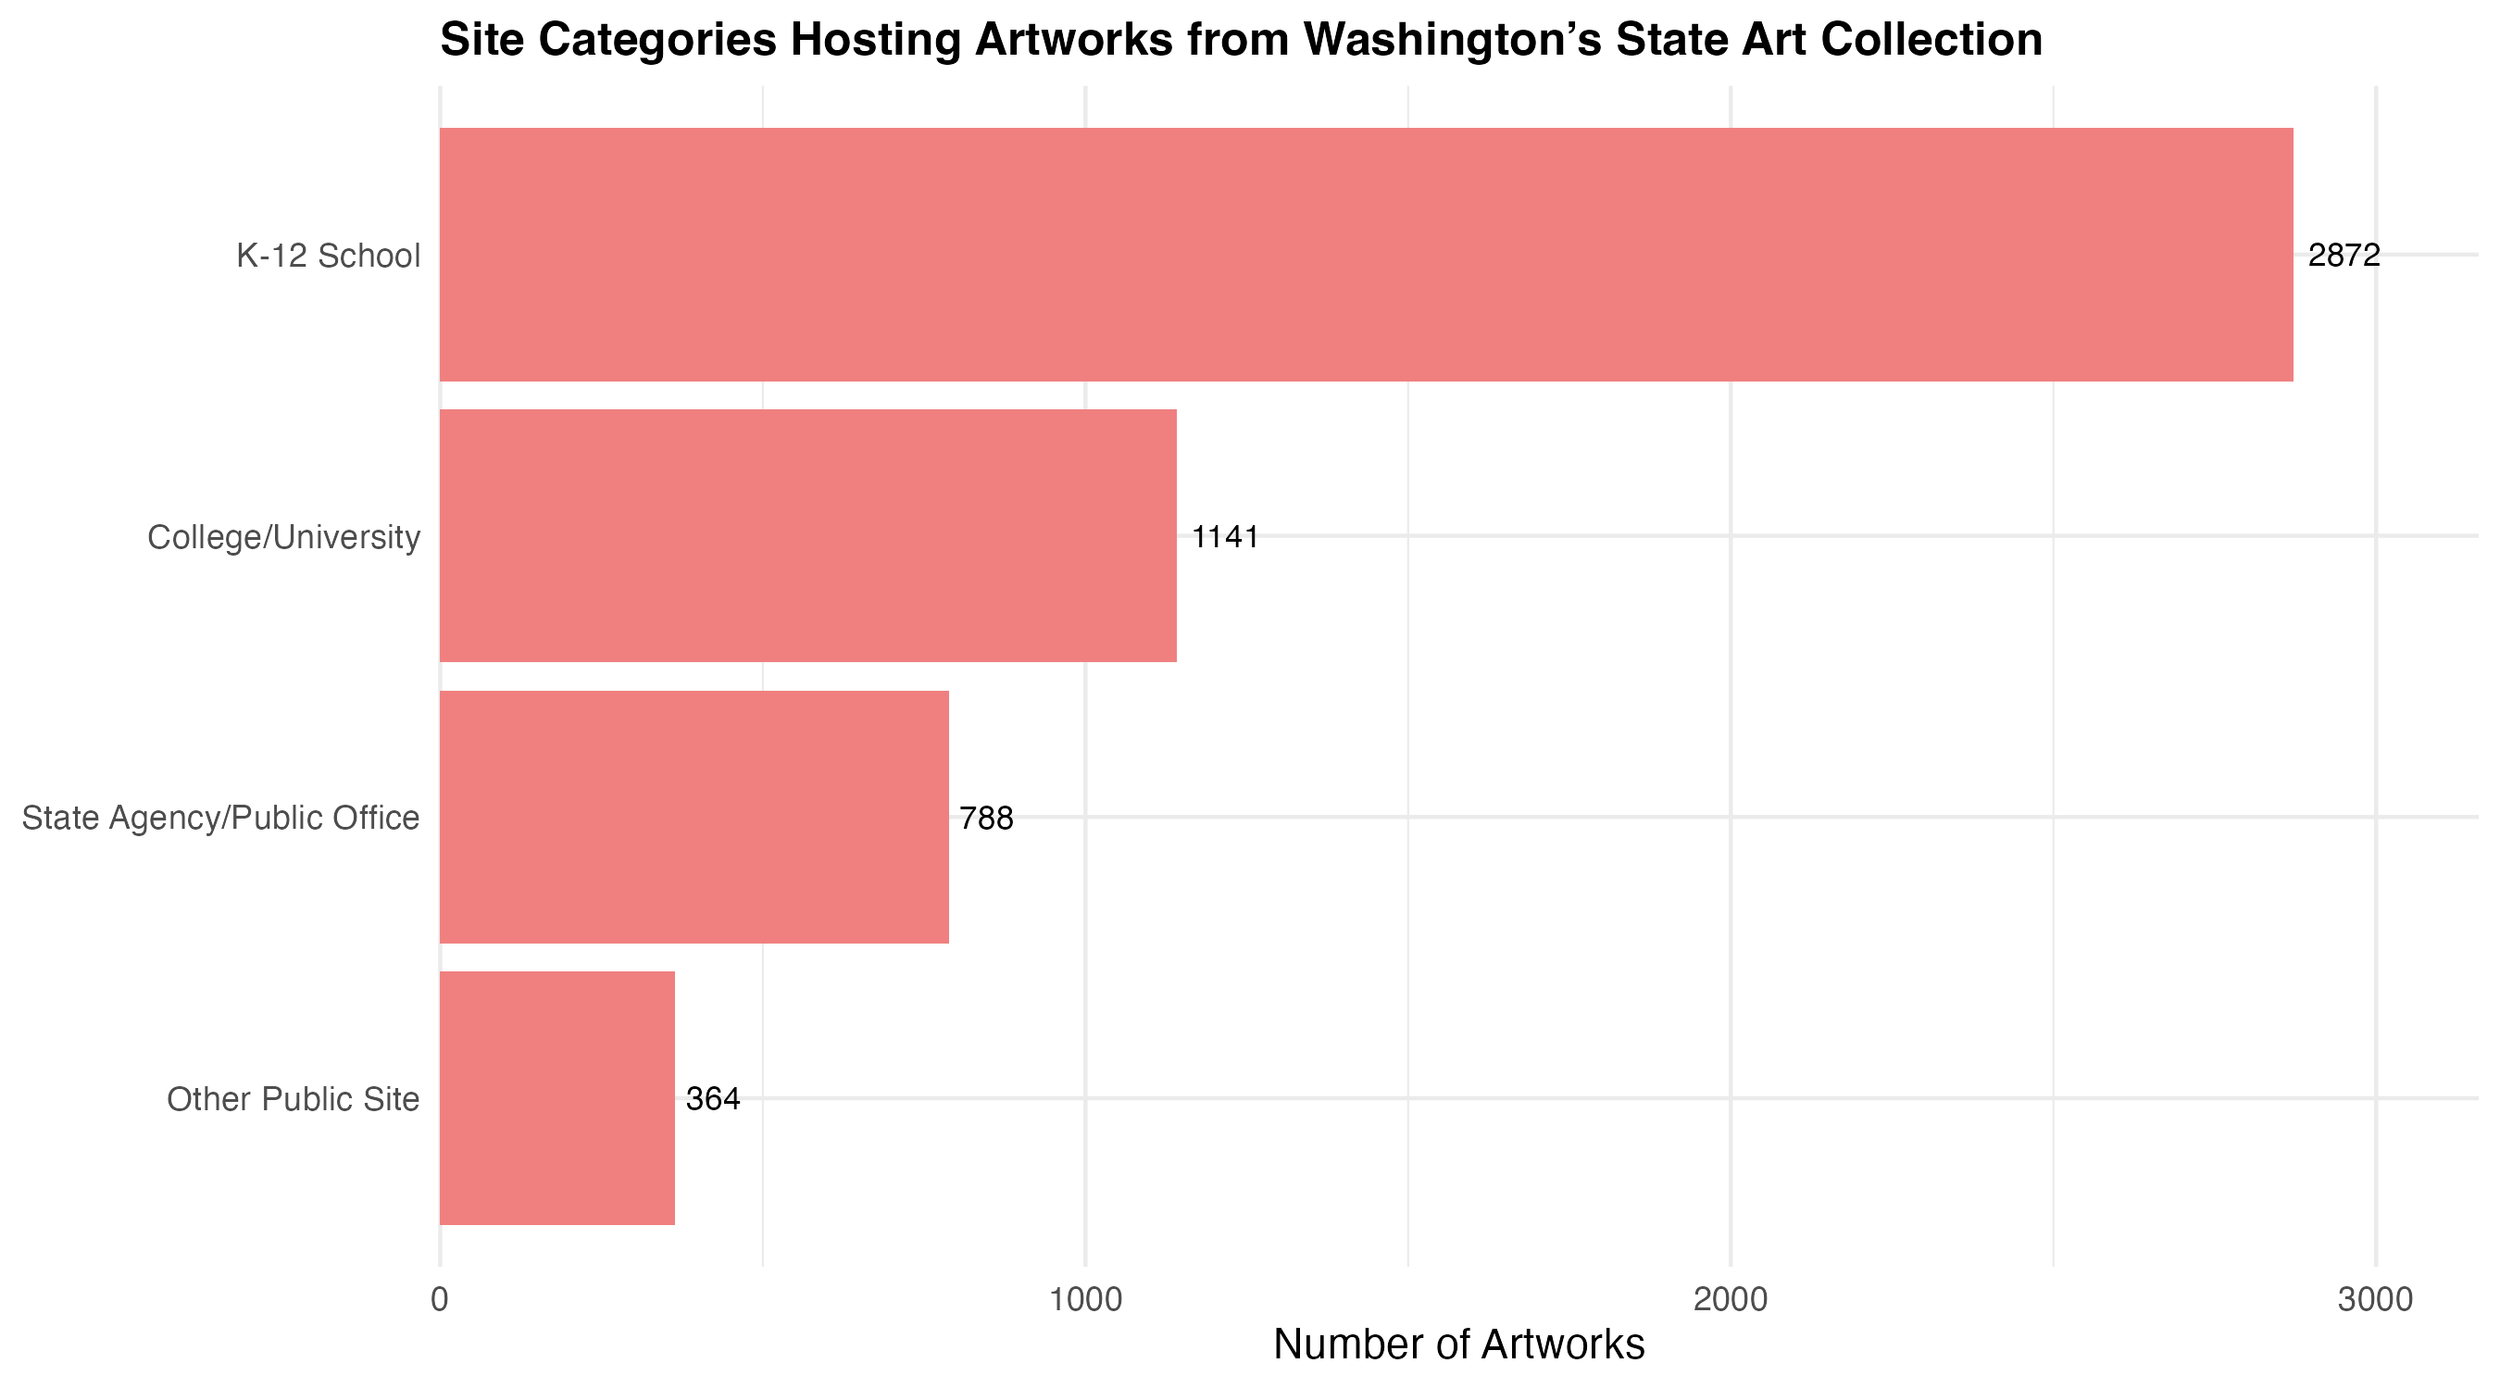
Figure 4. Site categories hosting Washington’s State Art Collection.
The site category chart was the most revealing for me. I created these categories by looking for keywords in the art site names, so this is an interpretive grouping rather than an official ArtsWA classification. I grouped sites into categories such as K-12 School, College/University, State Agency/Public Office, and Other Public Site.
The results show that K-12 schools host the largest number of artworks, with 2,872 records. Colleges and universities follow with 1,141. State agencies and public offices account for 788, while other public sites account for 364. This shifts the story from geography to access. The collection is not only concentrated in certain cities. It is also concentrated in certain kinds of spaces, especially educational and institutional ones.
On one hand, that is a powerful model for public art. Art in schools can become part of a student’s everyday environment. It does not require a museum ticket or a special trip. It can sit in a hallway, cafeteria, library, office, or courtyard and become part of the background of learning.
On the other hand, schools are not fully open public spaces. A K-12 school may be publicly funded, but most people cannot simply walk inside to view an artwork. The same is true for many government offices or agency buildings. They may be public in ownership and purpose, but access is shaped by schedules, security, visitor policies, and whether a person has a reason to be there.
This is the part of the project where the word “public” started to feel layered. Public ownership, public location, and public access are related, but they are not the same thing.
What the Dataset Makes Visible
One of the strengths of this dataset is that it gathers scattered cultural information into a form that can be searched, counted, mapped, and compared. Without the dataset, it would be much harder to see that Olympia has such a large share of artworks, or that K-12 schools host more than half of the records in my site category analysis.
The data also makes the collection feel less abstract. It shows that public art is not just out there somewhere. It is tied to cities, schools, campuses, offices, and other everyday spaces. In that way, the dataset acts almost like a discovery tool. It gives structure to a collection that most people would otherwise encounter only in fragments.
There is also something valuable about seeing public art at scale. Looking at one artwork can tell us about one artist, one site, or one community. Looking at thousands of records can show patterns of placement, format, and institutional connection. Both views matter. The dataset does not replace the individual artwork, but it helps reveal the larger system around it.
What the Dataset Cannot Tell Us
At the same time, the dataset has clear limits. It does not represent all public art in Washington. It represents Washington’s State Art Collection. That means it likely leaves out city murals, community art projects, temporary installations, private public-facing artworks, and other forms of public art outside this specific state-managed collection.
It also cannot tell us how people experience the art. The data can say that an artwork is located at a school, but not whether students notice it. It can provide the city and site, but not whether the work feels meaningful to the people who pass by it.
The site categories also have limitations. Since I created them using keywords in the site names, they are useful for broad comparison but not perfect. Some sites could fit more than one category, and “Other Public Site” is still a broad group. A more detailed version of this project would require closer review of individual sites and probably more domain knowledge about how ArtsWA classifies public locations.
There is also an ethical side to treating a cultural collection as data. Official datasets can appear neutral because they are organized, structured, and published through government portals. But every dataset reflects decisions. Someone decided what was collected, where it was placed, how it was described, and what fields were included. Those decisions shape what later users can find and analyze.
So, while this dataset helps make the State Art Collection more visible, it should not be treated as a complete picture of cultural access in Washington. It is one official record of one public collection, shaped by institutional history and documentation practices.
Future Work
With more time, I would want to refine the site categories. I would separate libraries, healthcare spaces, correctional facilities, government offices, and community sites instead of grouping some of them into broader categories. That would make the access question more specific.
I would also like to compare artwork locations with population or county-level data. A city with many artworks may also have a larger population, more public buildings, or more state institutions. Looking at artworks per capita or by county could show whether some areas are more represented than they first appear.
Public Does Not Always Mean Visible
The biggest takeaway from this project is that public art depends on more than public ownership. Washington’s State Art Collection is spread across the state, but it is also concentrated in certain cities. It includes multiple art forms, but sculpture and painting dominate. It is housed in public and institutional spaces, but many of those spaces are not equally open to everyone.
The dataset makes the collection easier to see, but it also shows why visibility is complicated. Data can point us toward where artworks are located and how they are categorized. It can reveal patterns that would be hard to notice otherwise, but it is also important to keep in mind that it cannot fully answer what those artworks mean to the people who live, study, work, or gather near them.
That is why I see this dataset as both useful and incomplete. It opens a window into Washington’s public art landscape, but it also reminds us that access is never only about location. It is about documentation, discoverability, physical space, institutional context, and whether people are actually able to encounter the art that is meant to belong to them.
References
ArtsWA. (n.d.). Washington State Arts Commission. https://www.arts.wa.gov/public-art/
Washington State Arts Commission. (2024). Washington’s State Art Collection 2024-07-15 [Dataset]. Data.WA. https://data.wa.gov/Culture-and-Community/Washington-s-State-Art-Collection-2024-07-15/pmxk-qxai/about_data
Datawrapper. (n.d.). Datawrapper. https://www.datawrapper.de/